Analytics
Enabling analytics is a straightforward process. Simply navigate to the "Set Settings" tab to configure analytics.
Once configured, a machine learning model will be trained on each tagged time series collection in your set and will be re-trained as new data is added, typically once per day.
Your data will be reprocessed by the trained model approximately once per hour as new data is added.
Configuration:
You can fine-tune the machine learning model trained on your data using the following properties.
it may take up to 24 hours for these changes to take effect
Seasonality
Configuring seasonality helps the machine learning algorithm understand the natural repeating cycles in your data.
For example:
- Stock market data may exhibit no seasonality since there may be no obvious repeating patterns
- Weather data will exhibit daily (night and day) and yearly (seasonal changes) seasonality
- Supermarket sales may exhibit daily (store opening/closing), weekly (weekend shopping peak), and yearly (holiday season) seasonality
Specifying all seasonalities where they do not exist may have negative effects on the models ability to understand your data.
Rolling average
The rolling average value is used to smooth the raw data so it is easier to visually spot trends in the data set.
For example, if your data cycles periodically from day to day, you may want to configure the rolling average to 24 hours for hourly analytics and 1 day for daily analytics.
Anomaly threshold
The anomaly threshold value tunes the sensitivity of the algorithm in detecting anomalies. A higher value makes the anomaly detection algorithm less sensitive.
Queries
[GET] /api/sets/{set_id}/data/analytics
This endpoint returns anomalies, actual, trend, and predicted values for a given time frame and resolution.
- Anomalies are outlying data points which occur when the actual value significantly varies from the predicted value
- Actual values represent the real data points submitted to the API
- Trend values are the rolling averages of the actual values
- Predicted values are the machine learning algorithm's expectations for your data at a given point in time
{
    "anomalies": [
        {
            "ts": 1706760000,
            "v": 978
        },
        ...
    ],
    "analytics": [
        [
            1706572800,
            4,
            4,
            60.24986636232288
        ],
        [
            1706576400,
            56,
            30,
            29.842107971607675
        ],
        [
            1706580000,
            38,
            32.666666666666664,
            12.485269109870629
        ],
        ...
    ]
}
The anomalies array contains anomaly objects which have a ts (unix second timestamp) and v (value) properties The analytics object contains an array of analytics values, the analytics value array is indexed as: analytics[0][0] - timestamp of the first analytics data point analytics[0][1] - actual value of the first analytics data point analytics[0][2] - rolling average of the first analytics data point analytics[0][3] - predicted value of the first analytics data point
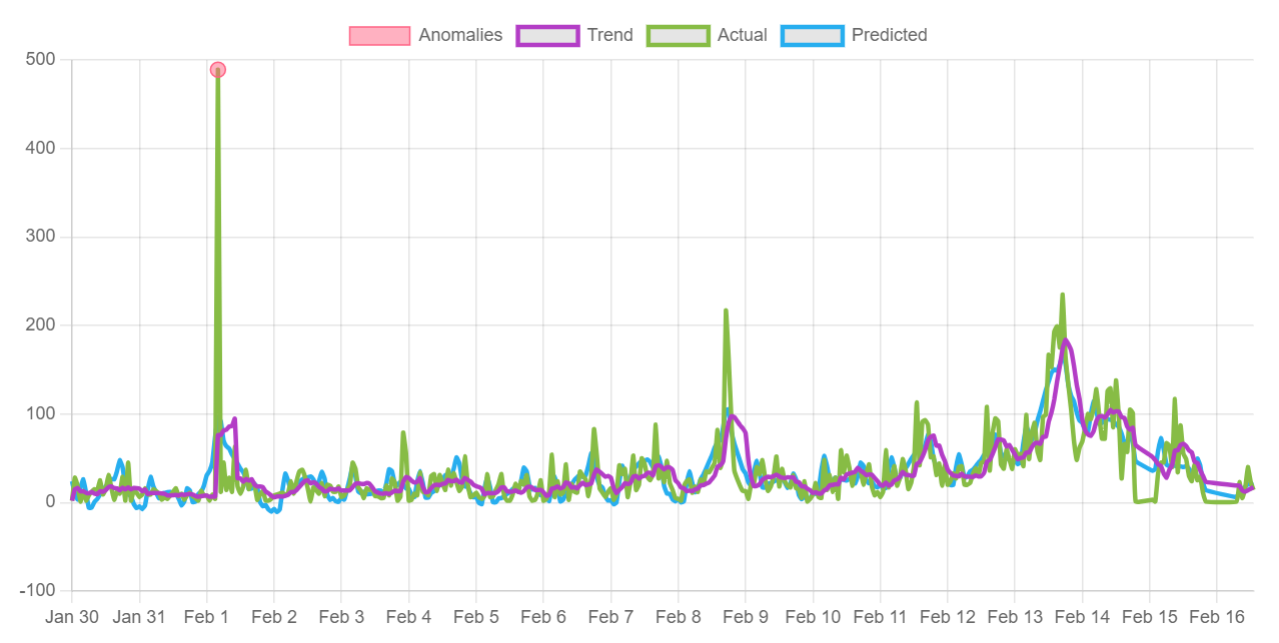
- [Actual - green] actual time series data
- [Predicted - blue] the expected value at a given point in time
- [Trend - purple] the rolling average
- [Anomaly - red] when the actual and predicted value differ above the anomaly threshold
[GET] /api/sets/{set_id}/data/seasonality
This endpoint returns any seasonality the machine learning model has detected.
{
    "daily": [
        0.16186269936139897,
        ...
    ],
    "weekly": [
        0.9458322904656383,
        ...
    ],
    "monthly": [
        0.14466066051875512,
        ...
    ],
    "yearly": [
        0.16155993570145805,
        ...
    ]
}
properties will be ommited if the seasonality was not configured
seasonality will be estimated if there is not enough data yet
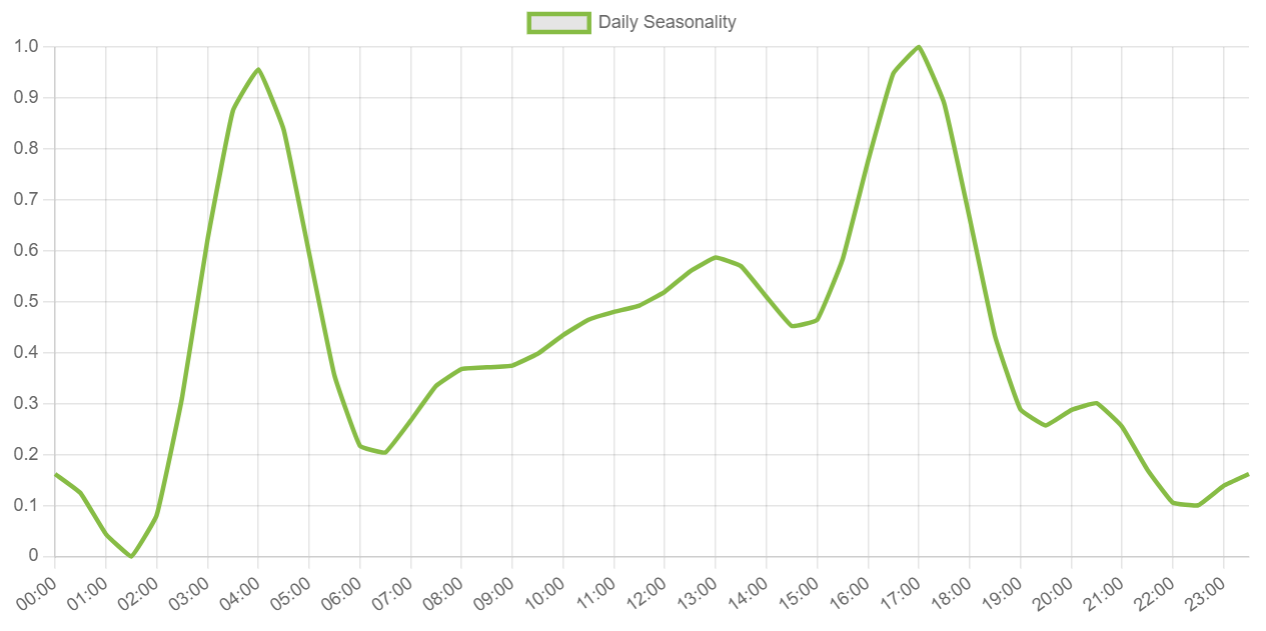
Daily seasonality
Daily fluctuations given as an array of doubles between 0 and 1, where 0 represents the minimum predicted value and 1 represents the maximum predicted value. There are 48 values returned, one for each 30 min period in a day.
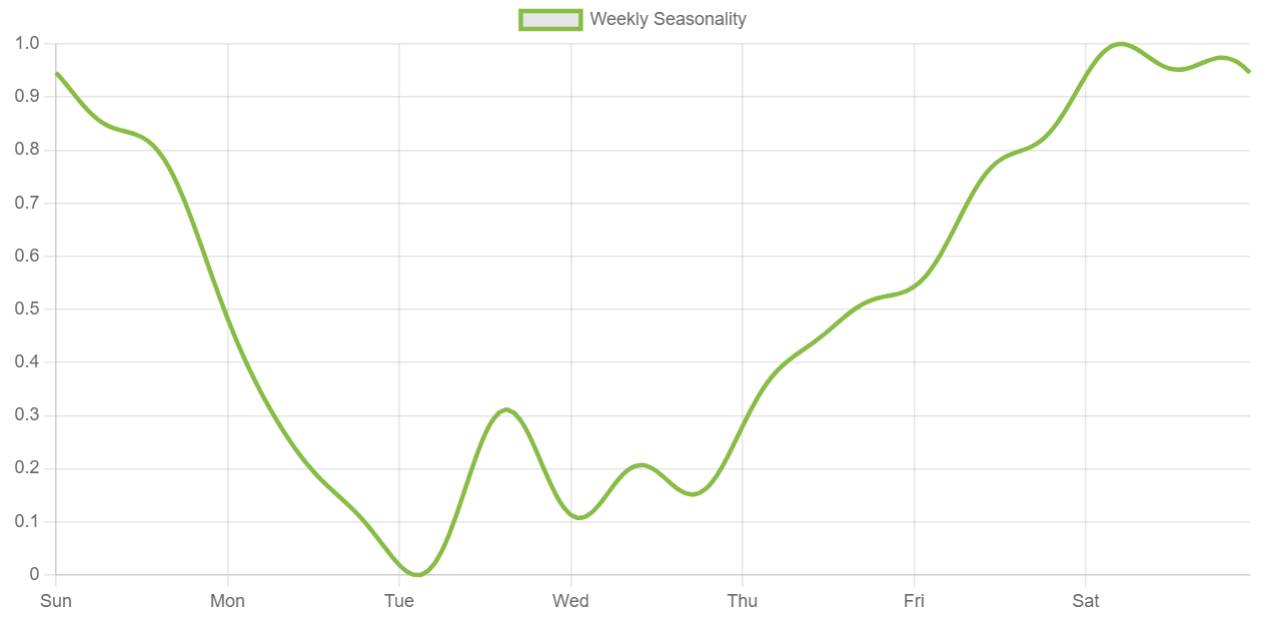
Weekly seasonality
Weekly fluctuations given as an array of doubles between 0 and 1, where 0 represents the minimum predicted value and 1 represents the predicted maximum value. There are 168 values returned, one for each 1 hour period in a week.
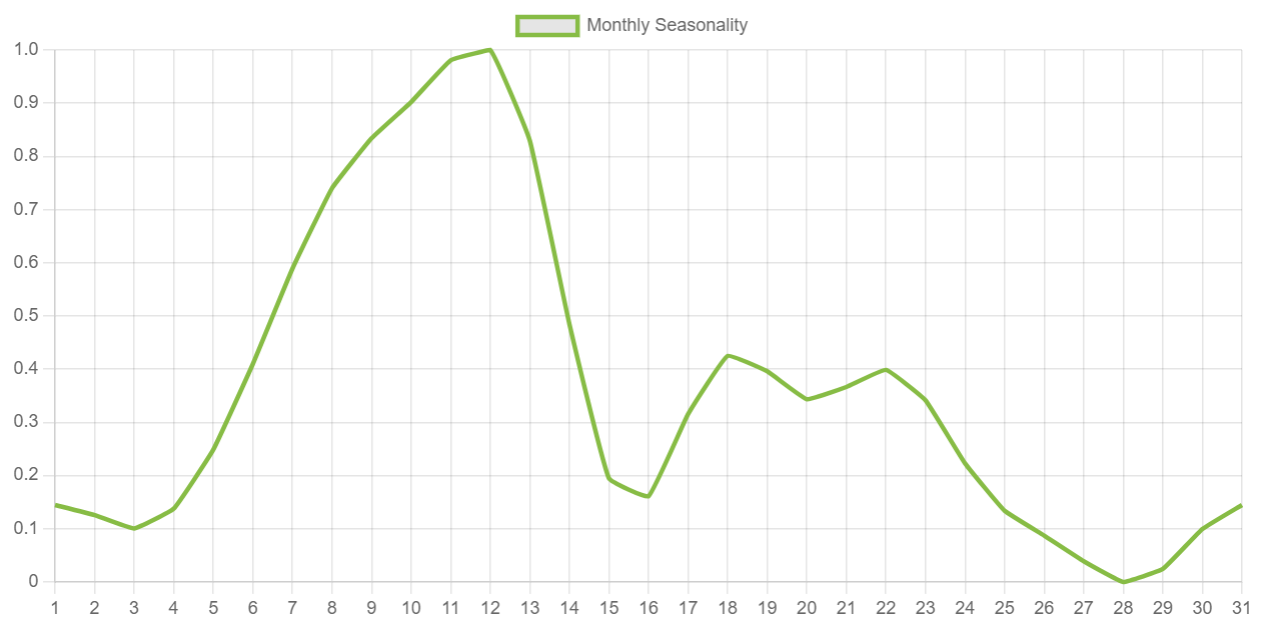
Monthly seasonality
Monthly fluctuations given as an array of doubles between 0 and 1, where 0 represents the minimum predicted value and 1 represents the predicted maximum value. There are 31 values returned, one for each day in a month.
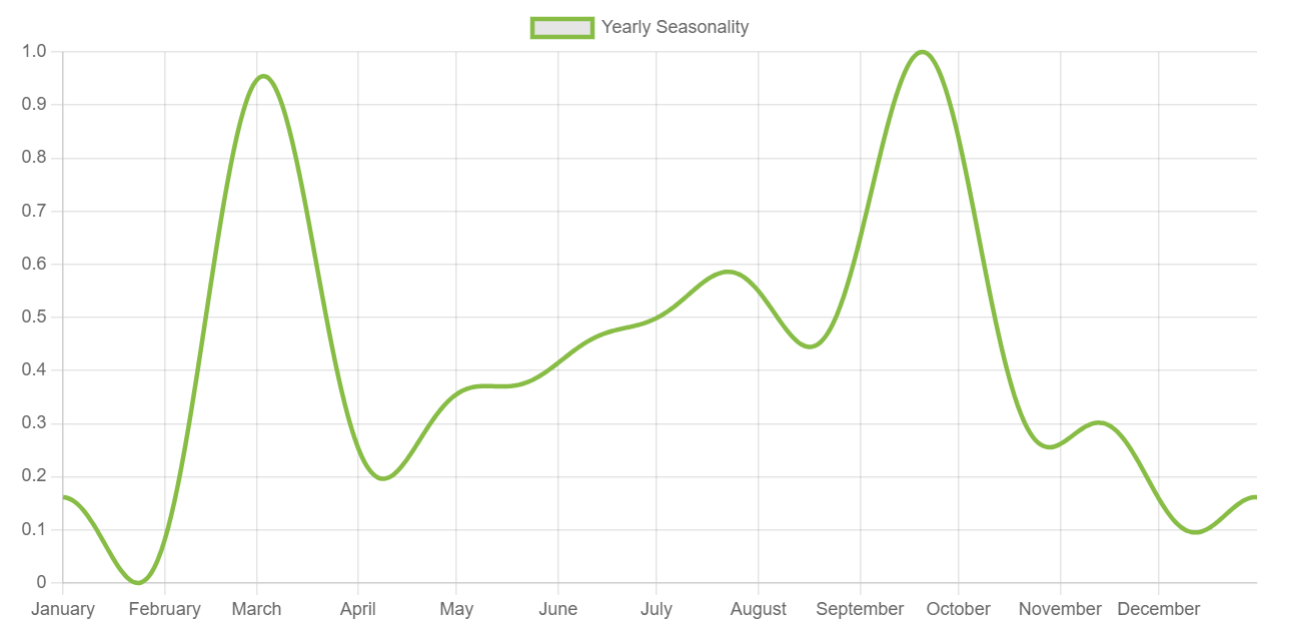
Yearly seasonality
Yearly fluctuations given as an array of doubles between 0 and 1, where 0 represents the minimum predicted value and 1 represents the predicted maximum value. There are 365 values returned, one for each day in a year.